Climb the ladder in 2016
How is your runbritain handicap score looking? If you have run in a runbritain licensed event or a parkrun since the beginning of 2010 you will have a handicap score between MINUS 8 to 36.0. How are you doing?
The handicap scoring system is now in its sixth year and the national ladder is more full than ever.
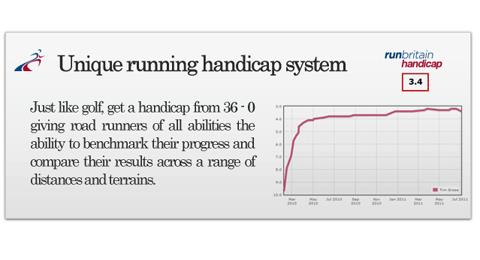
The scoring system, which has been developed in conjunction with the team behind the Power of 10 website, rewards regular racing and factors in a degree of difficulty for slower courses. It works just like a golf handicap system as a measure of the course difficulty and your ability on that course.
The system now includes all age groups, including juniors,from 800m and up and also includes cross country. At the beginning we only featured 5k, 10k, half marathon and marathon. It gives rankings within age groups and postcode areas. So, with more runners than ever in the system, we thought it would be a good time for a quick stock check and a peek at the standards to be in the top 1000 in all senior age group categories.
| Category | Handicap score to be in top 1000 | Runner number 1000 | Ballpark figures for 10k and Half Marathon (depending on level of difficulty of the course and conditions as well as regular racing) |
| M Open | -1.5 | Dean Richardson | 32:15/72:00 |
| W Open | 4.8 | Claire Donald | 38:30/87:15 |
| M35 | 3.3 | Alex Peyton-Jones | 39:00/83:30 |
| W35 | 12.0 | Samantha Bulkeley | 47:00/96:40 |
| M40 | 3.8 | Ian Benskin | 39:15/85:00 |
| W40 | 12.9 | Hayley Winder | 47:15/1:48:30 |
| M45 | 4.8 | Darren McGrath | 41:30/87:30 |
| W45 | 14.5 | Jacqui Reid | 47:30/1:50:30 |
| M50 | 6.4 | Phillip Wilson | 43:00/90:30 |
| W50 | 16.2 | Anne Budenberg | 49:30/1:52:00 |
| M55 | 9.5 | Neil Gunn | 45:00/92:40 |
| W55 | 20.5 | Julie Hankin | 50:30/1:54:30 |
| M60 | 13.4 | David Sawyer | 47:00/1:48:00 |
| W60 | 27.9 | Anita Jones | 61:15/2:00:00 |
| M65 | 18.1 | Derek Rose | 53:00/1:54:30 |
| M70 | 31.8 | Bob Richards | 55:30/1:55:30 |